
The Starter Dashboard Project: Increasing Access to Community Dashboards
By Hephzibah Okorie
Community Dashboards are essential but the barrier to entry is high. Here's how FCP is addressing this challenge.
Most community dashboards don’t survive. A few years ago, FCP researched and counted community dashboards maintained by place-based partnerships across the country. Two years later, a little over 50% were gone. We wrote about why and how organizations can improve those odds in an earlier post. But what about the dashboards that never get built? Drawing from our work with our grantees as well as our learnings across the sector, we know that the challenges faced by established organizations also impede nascent orgs. Inadequate data infrastructure, limited access, expertise and capacity crunches, as well as low community engagement all raise the barriers to entry. Here’s FCP’s approach to solving this challenge.
Community dashboards function as critical infrastructure for community coalitions working locally to shift systems that influence opportunities for thriving. They serve to reinforce local frameworks for aligning on collective goals and outcomes, support development of aligned strategies, maintain long-term commitment and assess ongoing impact.
Despite this clear value, dashboards are often expensive to develop and sustain in the long term, and alongside other data needs, are typically underfunded in the granting landscape. They require significant technical expertise as well as intentional community and partner engagement to ensure support and adoption. These constraints form a barrier to resource strapped organizations and dampen the spread and uptake of community dashboards as well as curtailing their potential impact on regional alignment and movement building.
Last year, in collaboration with our technical partners at North Arrow, the FCP team began to address this challenge. Kicking off in the summer of 2025, we embarked on our Starter Dashboard Pilot with the goal of developing an offering that would provide quick, affordable access to a simple streamlined community dashboard while embedding opportunities for critical community engagement. Alongside our pilot cohort: St. George CDC (ME), United for Brownsville (NYC) and Naugatuck Valley Project (CT), we collaborated over the next nine months, to design and develop a dashboard prototype that shows longitudinal community performance on the metrics that matter to them while also facilitating community engagement, data transparency and interpretation.
As with any project grounded in community, our learnings along the way far surpassed our assumptions going into the project. Here are a few of those lessons:
As with any project grounded in community, our learnings along the way far surpassed our assumptions going into the project. Here are a few of those lessons:
Community engagement: Communities dashboards need to cater to a broad range of distinct audiences including residents, program partners, local business owners, policy makers and prospective funders. who often have differing needs and varying comfort with data engagement and adoption. The only way to meet these needs is to include the community in the process.
As reflected by its inclusion in FCP’s six effective practices, continuous community engagement is an essential component that should be treated as an integral part of the process, not simply as an add on. For our pilot cohort, this engagement was two-fold. During the dashboard build, community representatives were involved in choosing and validating the outcome areas and associated metrics, ensuring that they were a realistic measure for local lived experiences. After the build, residents, community partners and other stakeholders have been key to facilitating buy-in or surfacing areas of improvement with the initial version of the tool.
When we first designed the pilot, we thought we had planned adequately for community engagement. In keeping with the promise of the starter dashboards—inexpensive, efficient and quickly-deployed— our initial plan only included about eight weeks for community conversations. Now, at the end of that process, we recall the phrase that “change only moves at the speed of trust”.The transparency and accountability that comes with a dashboard can either form a foundation for tighter collaboration or scare potential partners back into their operational silos. Trust is often the deciding factor.
Our pilot cohort reinforced how integral community engagement is to building and strengthening a community’s trust and faith in each other. Without the time, funding, and resources to engage adequately with a community, the trust-building potential of a community dashboard is curtailed before it ever gets off the ground. In our next iteration of the Starter Dashboard project, we are committing to not just developing dashboards but also right-sizing the funding, time and resource allocations for supporting community engagement during the dashboard build and in the critical months after to facilitate community buy-in
Narratives matter: Communities often have pre-existing local narratives and understandings of the issues that challenge them. Sometimes, as we saw with our pilot cohort, the metrics used on a community dashboard can diverge from these narratives and paint a different picture than the community expects. If carelessly communicated, this can have the unfortunate outcome of disrupting local trust, which is vital for sustaining a community’s willingness to engage in the transparency and accountability needed for systems change efforts.
In addition to thoughtfully choosing metrics that directly speak to the desired outcomes, measurement should always be accompanied by narratives that anticipate gaps in understanding and provide the needed context, insights, and action pathways to appropriately steward community engagement. For example, our partners at United for Brownsville have worked closely with their community advisory boards to interpret the insights from the dashboard together and use it to collectively identify strategic priorities for the community. In doing so, they have identified the need for specific capacity that supports the advisory council, and other community members in interpreting the data dashboards and identifying corresponding action pathways.
It is important that community dashboards resonate with lived realities without obscuring the necessary transparency needed to propel communities into action. Thoughtfully crafted narratives can do this while painting a unifying vision and reinforcing a sense of community agency.
Challenges and opportunities in rural areas: Our starter dashboards relied primarily on federal and regional publicly available data sets. While easily accessible, many of these data sources might only offer granularity up to the census tract or block group level. This means that key differences within smaller units such as neighborhoods can be minimized within averages.
For instance, in communities such as St. George’s, a rural community in coastal Maine which also doubles as a destination vacation location, the massive wealth disparities between year round residents and seasonal residents or second home owners are obfuscated within a single census average. This meant that the census data reflected a much different, often rosier reality from the locally validated narrative. These instances further reinforce the need for narrative driven dashboards that contextualize data and highlight the value of regional or local data sources that offer higher granularity and paint a more nuanced and accurate picture.
Longitudinal data: Our initial prototype of the starter dashboards did not include longitudinal data. Not because we thought it was unimportant; on the contrary, we believe that longitudinal data is vital context for accurately understanding a community’s trajectory on key metrics. Rather, that decision was motivated by structural constraints within our platform of choice as well as a desire to maintain fidelity with the cost-effective proposition of the starter dashboard project.
In hindsight, we understand now, that in the pursuit of cost-effectiveness, longitudinal data simply cannot be compromised on. Without a longitudinal view, all you have is a snapshot of the recent past. While informative to an extent, snapshots tell a one-dimensional story that is lacking in historical texture. At best, they offer inadequate insight but at worst, they can skew the conclusions that audiences draw from the dashboard.
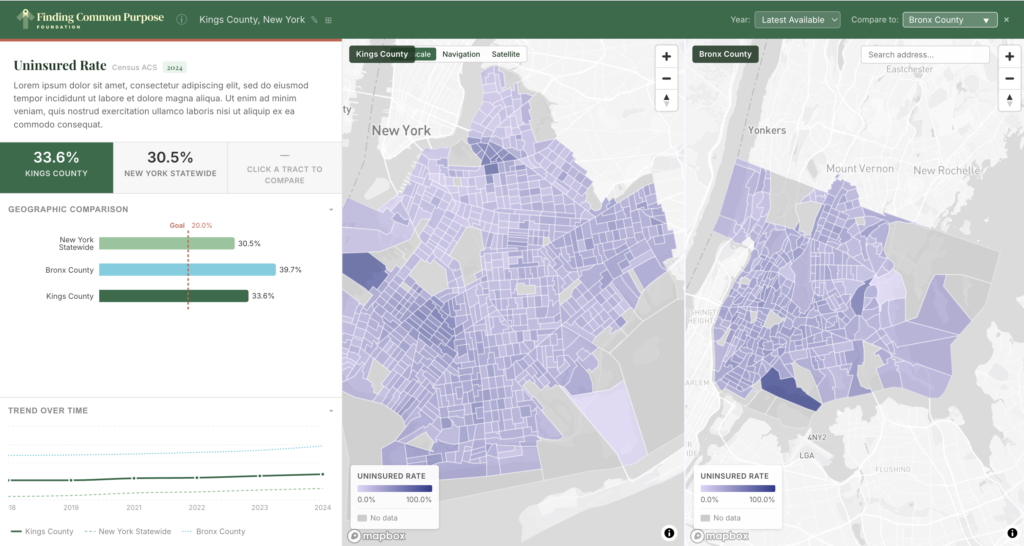
Our current iteration of the starter dashboard not only includes longitudinal data but also allows for regional comparisons, enabling communities to understand their trajectory in comparison to neighboring counties or state averages, adding further context and identifying opportunities for peer learning.
“Partnership with FCP has pushed us to clarify which indicators matter most, align them with our long-term strategy, and anticipate the support residents will need to confidently use the [community] dashboard themselves.”
This investment provided an incredible opportunity to develop a tool that meets the needs of real communities in an affordable and accessible manner. Our pilot cohort have implemented their dashboards in a variety of ways—from guiding community conversations to strengthening strategic conversations and funding asks — that reinforce the promise of a starter dashboard.
The starter dashboard pilot was an opportunity for FCP to learn about what works, and what doesn’t. While this pilot wasn’t perfect, we know that no pilot project is without its challenges. What matters is how we meet those challenges, and improve along the way. True to our organizational principle of learning in partnership, we have continued to improve the starter dashboard infrastructure as well as the development process, implementing the lessons above and relying on ongoing feedback from the pilot cohort to create a well-rounded, accessible, and affordable experience that meets the needs of each community partnership.
These learnings will be implemented with future starter dashboard cohorts. To learn more, check out the resources below.